
November Market Insights
Corporate Earnings
Third quarter earnings season is rapidly coming to a close in successful fashion. With all of the S&P 500 having reported earnings results, 83% of index components outperformed expectations on earnings per share, while 76% outperformed expectations on top-line revenue.1 Year-over year earnings per share growth for the index came in at 14.7%, which marks the 4th straight quarter of double-digit EPS growth.2
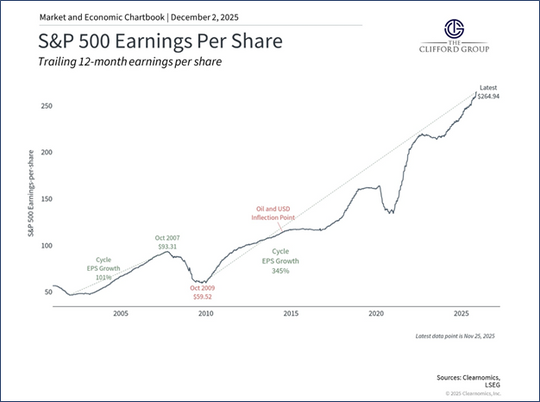
Source: Clearnomics, LSEG.
Such growth is as critical a factor as any in driving the market forward, particularly in the context of valuation concerns. On October 31st, the average forward-price to earnings ratio of S&P 500 companies, found by dividing the stock’s current price by projected EPS over the next twelve months, stood at 22.9.3 By November 21st, that number fell to 21.5, indicating that current prices are less expensive relative to projected company earnings.4 While this ratio is still elevated in comparison with historical averages, and pressure on prices in November played a role in reducing it, earnings growth remains the key player in mitigating and justifying high valuations in the market.
While the Magnificent 7 posted strong earnings, three sectors outperformed them on a sector-wide basis, a constructive sign that performance has broadened.5 In the highest-performing sector, information technology, more than 90 percent of companies beat revenue expectations and 98 percent topped earnings forecasts.6
Household Economic Health and Consumer Spending
Consumer spending is a key driver of economic growth, accounting for nearly 70% of gross domestic product.7 As a result, spending figures can be both a prime indicator of growth, as well as a firm insight into consumer sentiment. Current consumer trends tell a mixed story. The so called “K-shaped economy,” where higher income households have experienced considerable wealth appreciation in recent years while lower-income households have struggled to make gains, has begun to reveal itself in spending figures. Same store sales for companies located in middle to higher-income zip codes increased by 2.5% over the past year. During this same timeframe, same store sales for locations in lower-income zip codes grew by only 0.2%.8 While the gap in growth is notable, this reading is the first time that same store sales have experienced positive growth in lower income communities since 2023, indicating a directionally positive trend.9
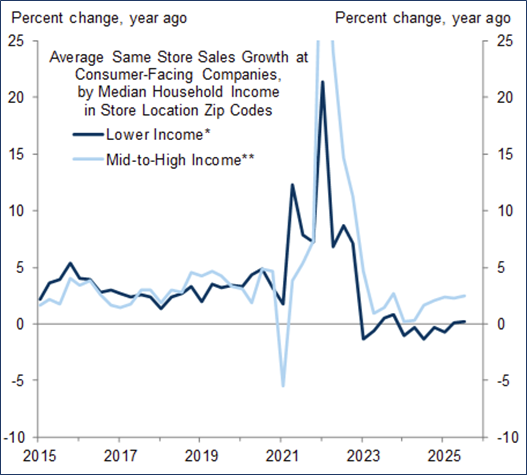
Source: Goldman Sachs.
The K-Shaped economy does, however, help to explain the divergence of consumer sentiment survey readings from realized consumer spending. The University of Michigan’s monthly Surveys of Consumers showed a November consumer sentiment reading of 51.0, down 4.9% from October.10 This reading, considered very low, led many analysts to predict underperformance on Black Friday, a critically important day for retail sales.11 Instead, consumers spent over $44 billion, a 7% increase from last year’s total.12
Looking ahead, we expect tax changes, rate cuts, and moderating inflation to support consumer spending in 2026. Under the One Big Beautiful Bill Act (OBBBA), the average tax refund is expected to climb from $3,200 to $4,000 in the new year.13 While inflation has ticked up and is expected to continue to modestly increase into mid-2026, current expectations are that it will begin to decline in the third quarter once tariff effects are fully absorbed.14 Finally, although the labor market has softened, a continued rate-cutting cycle should help stabilize hiring and wage growth.
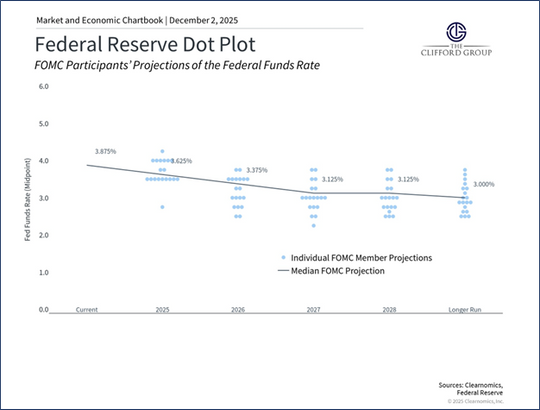
Source: Clearnomics, Federal Reserve
Citations:
1. Butters, J. Earnings Insight.Factset, November 21, 2025.
2. Dhillon, T. S&P 500Earnings Dashboard 25Q3.LSEG I/B/E/S, November 28, 2025.
3. Dr. Kelly, D. et al. Guide to the Markets.J.P. Morgan Asset Management, October 31, 2025.
4. Butters, J. Earnings Insight.Factset, November 21, 2025.
5. King, C. Cheery earnings, leery investors, and an optimistic equity outlook.BlackRock, November 26, 2025.
6. Ibid.
7. U.S. Bureau of Economic Analysis.Shares of gross domestic product: personal consumption expenditures.Retrieved from FRED, Federal Reserve Bank of St. Louis, December 2, 2025.
8. Walker, R.Low-End Consumer Underperformance; Growing AI Focus in Labor Market Discussions.Goldman Sachs, December 1, 2025.
9. Ibid.
10. University of Michigan.Surveys of Consumers: Final Results for November 2025. University of Michigan, November 21, 2025.
11. Manley, J. Are rate cuts helping consumers? J.P. Morgan Asset Management, November 26, 2025.
12. Reuters.Record shoppers, online sales surge signal strong US holiday season momentum. Reuters, December 2, 2025.
13. Dr. Kelly, D. The Health of the Consumer.J.P. Morgan Asset Management, November 24, 2025.
14. Ibid.
Important Information
The Clifford Group LLC (“The Clifford Group”) is a registered investment advisor. Advisory services are only offered to clients or prospective clients where The Clifford Group and its representatives are properly licensed or exempt from licensure. The information provided is for educational and informational purposes only and does not constitute investment advice and it should not be relied on as such. It should not be considered a solicitation to buy or an offer to sell a security. It does not take into account any investor’s particular investment objectives, strategies, tax status or investment horizon. You should consult your attorney or tax advisor. The views expressed in this commentary are subject to change based on market and other conditions. These documents may contain certain statements that may be deemed forward looking statements. Please note that any such statements are not guarantees of any future performance and actual results or developments may differ materially from those projected. Any projections, market outlooks, or estimates are based upon certain assumptions and should not be construed as indicative of actual events that will occur. All information has been obtained from sources believed to be reliable, but its accuracy is not guaranteed. There is no representation or warranty as to the current accuracy, reliability, or completeness of, nor liability for, decisions based on such information and it should not be relied on as such. The information contained above is for illustrative purposes only.
For additional information, please visit our website at
www.thecliffordgrp.com.
Risk Disclosure
No investment strategy or risk management technique can guarantee returns or eliminate risk in any market environment. All investments include a risk of loss that clients should be prepared to bear. The principal risks of The Clifford Group strategies are disclosed in the publicly available Form ADV Part 2A. Risk associated with equity investing include stock values which may fluctuate in response to the activities of individual companies and general market and economic conditions. Investments in mid-sized companies may involve greater risks than in those of larger, better known companies, but may be less volatile than investments in smaller companies. Investments in small-sized companies may involve greater risks than in those of larger, better known companies.