
October Market Insights
The Equity Market and a Renewed Rate Cutting Cycle
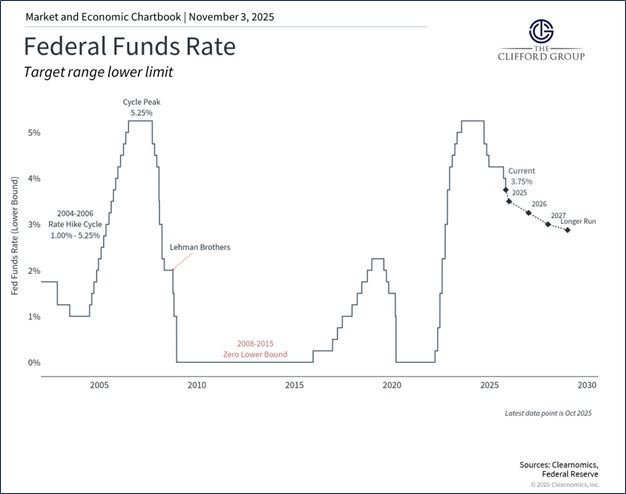
The sustained rally in U.S. equity markets continued through October, marking a sixth straight month of gains.1 This advance has been supported by renewed optimism following the rate cutting cycle the Federal Reserve began in September. Last week, the Fed delivered its second cut of the year, bringing the target range for the federal funds rate to 3.75% to 4%.2
During his press conference announcing the October cut, Fed Chair Jerome Powell emphasized that a third cut in December is not assured.3 Many viewed this as a more hawkish signal than expected. It likely reflects, at least in part, the fact that the Fed is operating with less economic data than usual. The ongoing federal government shutdown has delayed the release of labor market statistics along with other important indicators.4
Despite the missing data, analysts still expect a third cut in December.5 Chair Powell noted that inflation, after excluding the isolated effects of tariffs, is approaching the 2% target.6 If November data, assuming the government reopens, confirms this trend, then the risk of a cooling labor market would strengthen the case for one more cut.
Source: Clearnomics, Federal Reserve.
AI Bubble?
The rate cutting cycle was not the only driver of equity gains in October. The artificial intelligence theme, which has dominated market discussion for more than a year, remains strong. Some commentators have compared the current surge in AI-related stocks to the tech bubble of the late 1990s and early 2000s. Much of the comparison focuses on the rise in price to earnings ratios for AI-related companies. Although valuations are elevated, they remain far below the extremes observed before the tech bubble burst in 2001.
In March 2000, the S&P 500 Information Technology Index traded at an average price to earnings ratio of 55. By September 2025, the figure was 30, which is far closer to the long-run average.7 More important than the multiple itself is the health of the underlying companies. Several fundamental indicators suggest that today’s AI rally is more sustainable than the run-up that preceded the 2001 collapse.
The first key difference is funding. Current capital expenditures in AI are being financed by companies’ own free cash flow rather than the external financing that supported many less profitable tech firms in the 1990s.8 The second difference is the alignment between earnings growth and stock performance. From 1996 to 2000, tech stocks returned 439 percent while earnings grew only 80 percent. Over the four years ending September 30, 2025, tech company earnings grew 73 percent and stock prices rose 90 percent, which is much more closely aligned.9
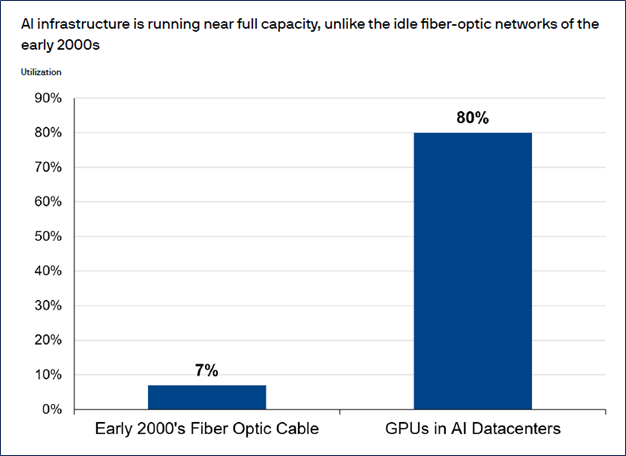
Demand fundamentals also look different. At the peak of the dot-com era, only 7 percent of fiber optic network capacity was being used. Today, data center utilization is roughly 80 percent.10 AI adoption remains early in its development, and although the scale of investment raises questions about ultimate returns, current fundamentals suggest that AI will continue to be a driving force in the market.
Source: J.P. Morgan Asset Management.
Equity Forecasts
While rate cuts and AI enthusiasm have contributed to positive equity performance this year, broader market gains have been supported by rising earnings. This trend is expected to extend into 2026. The 493 non-Magnificent 7 companies in the S&P 500 are projected to achieve profit growth of 12 percent in 2026.11
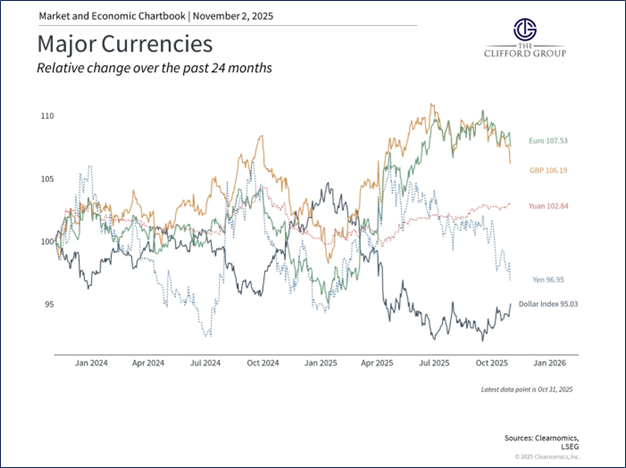
Outside the United States, Europe is expected to grow in 2026, supported by economic expansion, limited tariff effects, and constructive monetary policy. Emerging market stocks have rebounded significantly this year, and 2026 may deliver continued strength if the dollar weakens.12 Many variables could alter these forecasts, but current trends suggest that positive equity performance in the United States and abroad in 2025 is sustainable into 2026 and beyond.
Source: Clearnomics, LSEG.
Citations:
1) Steer, G. and Wells, P. US Stocks Ride AI Hype and Trade Truce to 6-month Winning Streak. The Financial Times, October 31st, 2025.
2) Board of Governors of the Federal Reserve System. Federal Reserve Press Release. Board of Governors of the Federal Reserve System, October 29th, 2025.
3) Hatzius, J. et al. US Daily: October FOMC Recap: Despite a More Hawkish Message, a December Cut Still Looks Likely (Mericle). Goldman Sachs, October 29th, 2025.
4) Gould, E. and Fast, J. Amid the shutdown data blackout, state unemployment insurance claims continue to shed light on the labor market. Economic Policy Institute, October 15th, 2025.
5) Hatzius, J. et al.US Daily: October FOMC Recap: Despite a More Hawkish Message, a December Cut Still Looks Likely (Mericle). Goldman Sachs, October 29th, 2025.
6) IBID.
7) BlackRock. Are we in a Bubble? An Optimistic View on Tech Stocks. BlackRock, October, 2025.
8) Aliaga, S and Cangialosi, N. Does Circularity in AI Deals Warn of a Bubble? J.P. Morgan Asset Management, October 17th, 2025.
9) BlackRock. Are we in a Bubble? An Optimistic View on Tech Stocks. BlackRock, October, 2025.
10) Aliaga, S and Cangialosi, N. Does Circularity in AI Deals Warn of a Bubble? J.P. Morgan Asset Management, October 17th, 2025.
11) Quinsee, P. Global Equity Views. J.P. Morgan Asset Management, October 2025.
12) IBID.
Important Information
The Clifford Group LLC (“The Clifford Group”) is a registered investment advisor. Advisory services are only offered to clients or prospective clients where The Clifford Group and its representatives are properly licensed or exempt from licensure. The information provided is for educational and informational purposes only and does not constitute investment advice and it should not be relied on as such. It should not be considered a solicitation to buy or an offer to sell a security. It does not take into account any investor’s particular investment objectives, strategies, tax status or investment horizon. You should consult your attorney or tax advisor. The views expressed in this commentary are subject to change based on market and other conditions. These documents may contain certain statements that may be deemed forward looking statements. Please note that any such statements are not guarantees of any future performance and actual results or developments may differ materially from those projected. Any projections, market outlooks, or estimates are based upon certain assumptions and should not be construed as indicative of actual events that will occur. All information has been obtained from sources believed to be reliable, but its accuracy is not guaranteed. There is no representation or warranty as to the current accuracy, reliability, or completeness of, nor liability for, decisions based on such information and it should not be relied on as such. The information contained above is for illustrative purposes only. The above targets are estimates based on certain assumptions and analysis made by the advisor. There is no guarantee that the estimates will be achieved.
For additional information, please visit our website at www.thecliffordgrp.com.
Risk Disclosure
No investment strategy or risk management technique can guarantee returns or eliminate risk in any market environment.
All investments include a risk of loss that clients should be prepared to bear. The principal risks of The Clifford Group strategies are disclosed in the publicly available Form ADV Part 2A. Asset Allocation may be used in an effort to manage risk and enhance returns. It does not, however, guarantee a profit or protect against loss. Generally, among asset classes, stocks are more volatile than bonds or short-term instruments. Government bonds and corporate bonds have more moderate short-term price fluctuations than stocks, but provide lower potential long-term returns. U.S. Treasury Bills maintain a stable value if held to maturity, but returns are generally only slightly above the inflation rate. Diversification does not ensure a profit or guarantee against loss. Risk associated with equity investing include stock values which may fluctuate in response to the activities of individual companies and general market and economic conditions. Investing in foreign domiciled securities may involve risk of capital loss from unfavorable fluctuation in currency values, withholding taxes, from differences in generally accepted accounting principles or from economic or political instability in other nations. Investing in foreign domiciled securities may involve risk of capital loss from unfavorable fluctuation in currency values, withholding taxes, from differences in generally accepted accounting principles or from economic or political instability in other nations. Investments in emerging or developing markets may be more volatile and less liquid than investing in developed markets and may involve exposure to economic structures that are generally less diverse and mature and to political systems which have less stability than those of more developed countries.