

The Economy
Energy prices have continued to be a key driver of sticky inflation over the last month, with headline CPI up 3.4% year over year and core CPI, which excludes food and energy, sitting at 2.4%. As a result of persistent inflation, the Federal Open Market Committee voted to raise rates for the first time since 2023 at its September meeting, increasing the federal funds target range by 0.25 percentage points to 3.75%-4.00%.¹ Current analyst projections call for one more hike at the FOMC’s December meeting, which would bring the upper end of the target range to 4.25%.²
Though headline inflation has seen the larger increase, Fed rate hikes have limited ability to influence that metric in the near term, given that recent pressure has been driven largely by energy-market disruptions and geopolitical risk. The Fed was likely more motivated to act because of the smaller but noticeable increase in core PCE in August of 0.27%.³ Despite the hike and the continued rise in bond yields, growth continues to look resilient. Current estimates suggest U.S. real GDP was tracking at a 3.3% annualized pace in the third quarter.⁴ Should elevated interest rates persist, 2027 GDP growth could be negatively impacted by roughly 0.2 to slightly more than 0.5 percentage points.⁵
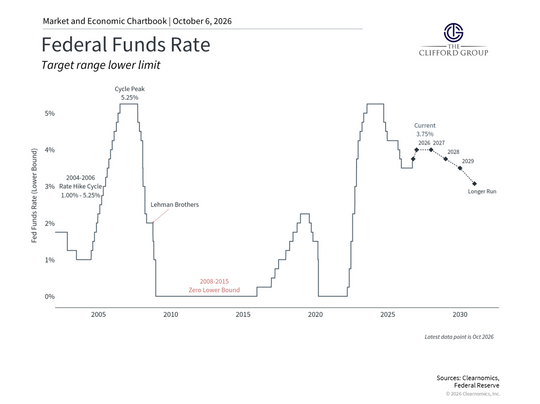
In the immediate aftermath of the Fed’s rate hike, expectations throughout the market were that a second rate hike was likely to come at the committee’s next meeting in October. These expectations changed, however, with the release of September’s nonfarm payroll report. The economy added 29,000 jobs in September, and the unemployment rate ticked up to 4.2%. The report also showed downward revisions to both the July and August payroll figures, lowering previously reported employment by a combined 60,000 jobs.⁶ These numbers by no means represent an alarming downturn in the labor market, but they do point to a slight softening on the employment side of the Fed’s dual mandate. Barring a surprising CPI inflation reading for September, that softening may give the committee room to hold rates at their current level when it meets at the end of October.⁷
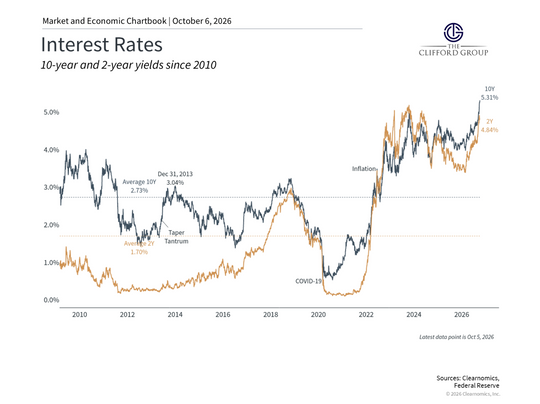
At the same time, the national deficit, resilient growth, and AI-related capital spending have continued to push Treasury yields higher. The 10-year Treasury yield currently sits near its highest level since 2002. In many ways, this is a more consequential story than the federal funds rate, as Treasury pricing influences many fundamental metrics in the economy. Mortgage rates, which often track the 10-year Treasury, are up more than 1 percentage point since February, and more than 90% of borrowers with loans outstanding now hold mortgage rates below current market rates.⁸ Business investment is also sensitive to higher rates, and sustained higher yields could reduce business capital expenditures by around 0.3 percentage points in 2027.⁹
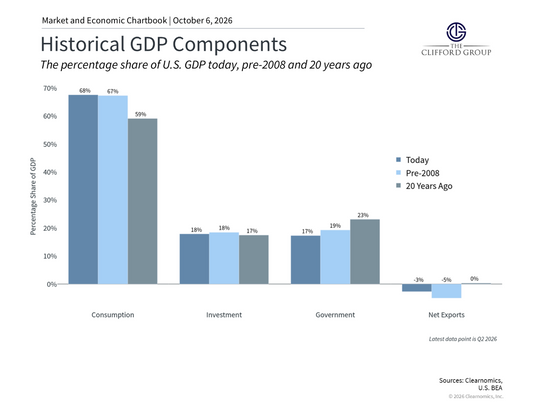
Despite the aforementioned road bumps, the American consumer has remained resilient. Over the past year, retail sales are up 5.36%, and personal savings have declined by 7.76%. Though sentiment, as measured by surveys, is down 9.07% during that time, consumers are spending as though they retain confidence in the economy and labor market. While some of the retail sales and savings metrics can be explained by inflation, a decline in the savings rate of households generally indicates that people are confident the economy will continue to grow and the labor market will continue to be dynamic, and as a result they choose current consumption. Should this trend continue, these metrics would serve as a tailwind to continued positive corporate earnings and GDP growth.
Equities
As 2026 has matured, the equity market has continued to march higher despite intermittent volatility caused by energy prices and rising yields. The S&P 500 and Nasdaq both closed at record highs on October 6. Even more encouraging, despite continued price appreciation, the forward price-to-earnings ratio of the index has declined by roughly 3 turns this year, from about 22x to about 19x.¹⁰ In essence, even though equities have continued to rally, earnings growth expectations for the coming year have risen faster than prices. That makes current levels appear more attractively priced than they were at the start of 2026.
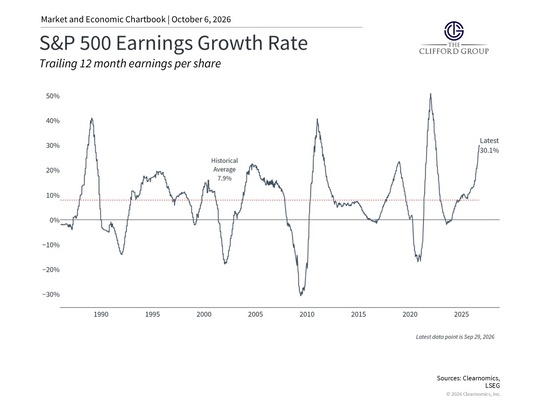
Current consensus expectations for third-quarter year-over-year earnings growth stand at 27%, the highest earnings growth expectation since 2021.¹¹ Furthermore, hyperscalers are expected to continue spending heavily on AI. Current projections indicate these companies will grow capex by 116% year over year.¹² Expectations for earnings growth in 2027 are promising as well. Companies are on track to deliver the third straight year of double-digit earnings growth in 2026, and forecasts for 2027 expect that streak to continue.¹³ Five-year forward earnings growth estimates are higher today than at any point in the last 40 years.¹⁴
Higher bond yields and geopolitical concerns have also spurred a strengthening of the U.S. dollar. Year to date, the dollar has climbed 4%.¹⁵ While this may reduce some of the localized gains companies experienced in their earnings from a weaker dollar earlier in the year, it may also lead to stronger relative U.S. equities and bond performance.¹⁶ Traditionally, climbing yields in a country’s bond market have supported its currency, as investors allocate capital to take advantage of yield opportunities. This may be a constructive setup for many U.S. asset classes, as foreign investors look to allocate to dollar-denominated assets to take advantage of currency and yield trends.
Though we have experienced volatility throughout the year, with energy prices and bond yields causing intermittent concern, expectations for domestic equities remain optimistic.
Citations
1) Akullian, K. First Fed Rate Hike in Years: What It May Mean for Investor Portfolios. BlackRock. September 18, 2026.
2) Ibid.
3) Hatzius, J. Global Views: Lower Inflation, Limited Hikes. Goldman Sachs. September 22, 2026.3
4) Ibid.
5) Pierfrancesco Mei. US Economics Analyst: How Will Higher Rates Affect the US Economy? Goldman Sachs. October 5, 2026.
6) Employment Situation Summary, September 2026. U.S. Bureau of Labor Statistics. October 2, 2026.
7) Feroli, M. US: Walk, Don’t Run. J.P. Morgan. October 2, 2026.
8) Pierfrancesco Mei. US Economics Analyst: How Will Higher Rates Affect the US Economy? Goldman Sachs. October 5, 2026.
9) Ibid.
10) Hussey, C. and Herr, S. End of Month Market Intelligence: pivot(al). Goldman Sachs. September 30, 2026.
11) Snider, B. et al. US Weekly Kickstart: Q3 2026 Earnings Season Preview. Goldman Sachs. October 2, 2026.
12) Ibid.
13) King, C et al. Equity Market Outlook, Q4 2026. BlackRock. September 2026.
14) Ibid.
15) Kelly, D et al. Guide to the Markets, U.S., 4Q 2026. J.P. Morgan Asset Management. October 2, 2026.
16) Ibid.
Important Information
The Clifford Group LLC (“The Clifford Group”) is a registered investment advisor. Advisory services are only offered to clients or prospective clients where The Clifford Group and its representatives are properly licensed or exempt from licensure. The information provided is for educational and informational purposes only and does not constitute investment advice and it should not be relied on as such. It should not be considered a solicitation to buy or an offer to sell a security. It does not take into account any investor’s particular investment objectives, strategies, tax status or investment horizon. You should consult your attorney or tax advisor. The views expressed in this commentary are subject to change based on market and other conditions. These documents may contain certain statements that may be deemed forward looking statements. Please note that any such statements are not guarantees of any future performance and actual results or developments may differ materially from those projected. Any projections, market outlooks, or estimates are based upon certain assumptions and should not be construed as indicative of actual events that will occur. All information has been obtained from sources believed to be reliable, but its accuracy is not guaranteed. There is no representation or warranty as to the current accuracy, reliability, or completeness of, nor liability for, decisions based on such information and it should not be relied on as such.
The information contained above is for illustrative purposes only.
For additional information, please visit our website at www.thecliffordgrp.com.
Risk Disclosure
No investment strategy or risk management technique can guarantee returns or eliminate risk in any market environment.
All investments include a risk of loss that clients should be prepared to bear. The principal risks of The Clifford Group strategies are disclosed in the publicly available Form ADV Part 2A.
Diversification does not ensure a profit or guarantee against loss. Risk associated with equity investing include stock values which may fluctuate in response to the activities of individual companies and general market and economic conditions. The major risks associated with investing in the natural resources sector, including large price volatility due to non-diversification and concentration in natural resources companies.
Performance Disclosure
Index returns are unmanaged and do not reflect the deduction of any fees or expenses. Index returns reflect all items of income, gain and loss and the reinvestment of dividends and other income. You cannot invest directly in an Index.
For additional information, please visit our website at
www.thecliffordgrp.com.